Fast and Reliable Convergence of Real-Time Kinematic Single Point Positioning Using Equivalent Elimination Principle
-
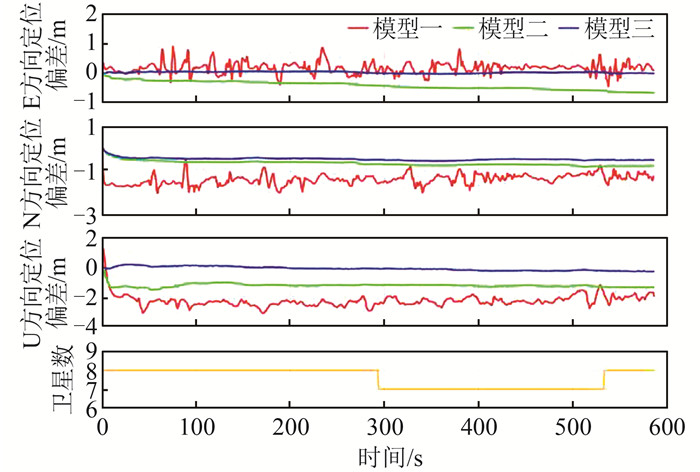
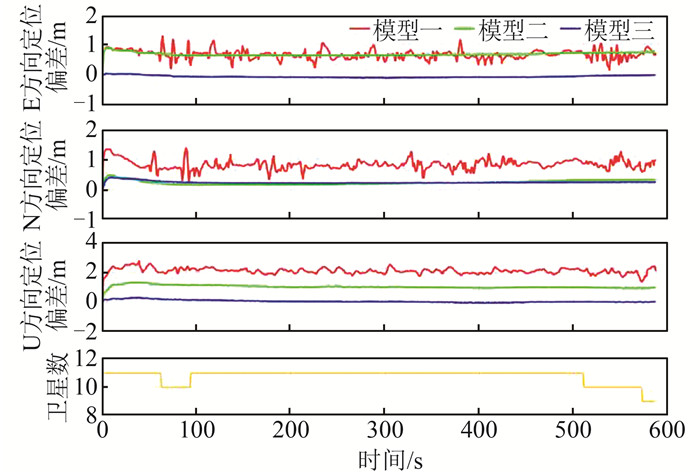
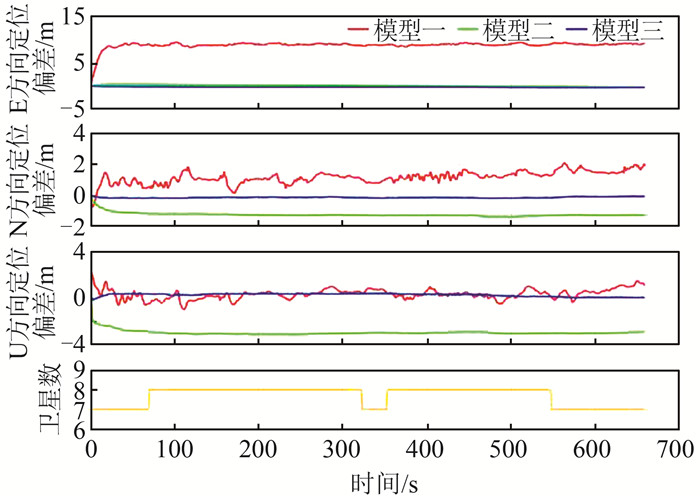
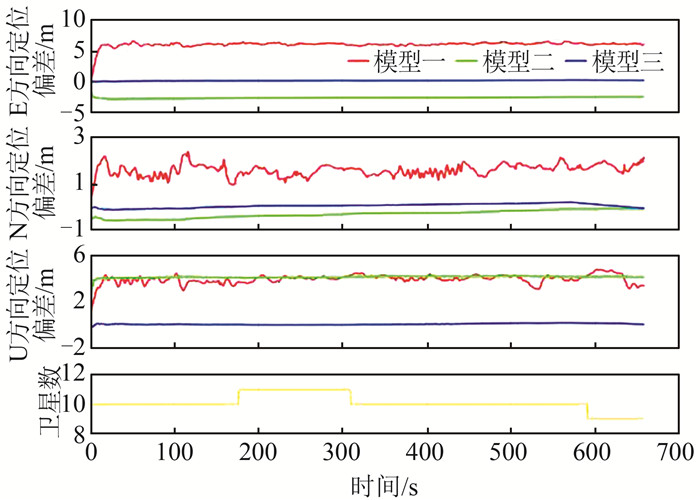
摘要: 无人机、自动驾驶等领域的快速发展对全球卫星导航系统实时动态定位提出了更高的精度要求,而传统基于多普勒测速的常速滤波模型和基于载波时间差分的位置变化滤波模型的定位精度难以实现动态目标位置信息的实时、准确、稳定获取。根据等价消去原理移除动态坐标参数,采用历元间差分观测值并充分顾及模型残差的影响,构建准静态卡尔曼滤波模型。利用滤波得到的模型残差对位置信息进行修正,极大削弱了直接采用相位时间差分获取位置变化量带来的模型残差累积。利用无人机和车辆平台采集的数据分别进行了GPS和北斗卫星导航系统(BeiDou satellite navigation system,BDS)的单频动态定位实验,结果显示,基于等价消去原理的滤波模型能实现优于30 s的定位收敛,相对首历元位置的三维定位偏差的标准差基本在10 cm以内,平面精度可达3 cm。另外,由于卫星数的差异,基于BDS的收敛速度和稳定性均优于GPS。Abstract:Objectives The rapid development of unmanned aerial vehicles (UAV), autonomous driving and other fields have put forward higher accuracy requirements for global navigation satellite system real-time kinematic positioning. However, the traditional filtering model with constant velocities based on the Doppler measurements, or the filtering model with position variations based on the time-differenced carrier phase measurements, is difficult to describe the accurate state of the moving targets, and thus cannot acquire their real-time, accurate, and stable location information, especially when the receiver can only observe a single system. To solve this issue, we propose a novel filtering model for real-time kinematic positioning, and its performance is compared with the above two filtering models.Methods The time-variable parameters, including the coordinates and the receiver clock error, are eliminated according to the equivalent elimination principle.The integer ambiguities are removed and the atmospheric delays are reduced using the time-differenced observations. The quasi-static Kalman filtering model is constructed by considering the impact of the model residuals, and the described state in the filtering model becomes much more consistent with the reality. The estimated model residuals are used to correct the position information of moving targets. In this way, the accumulation of the model residuals when directly using the time-differenced phase observables to obtain the position variations are greatly alleviated. The kinematic positioning experiments were carried out using the single-frequency GPS and BeiDou satellite navigation system(BDS) data collected by the UAV and the vehicle platforms, respectively, and the obtained results from three different filtering models are compared with the referenced results from real-time kinematic positioning.Results Experimental results show that: (1) The filtering model based on the equivalent elimination principle can achieve positioning convergence better than 30 s. Compared with the filtering model based on time-differenced phase observables, the convergence time of the proposed method is improved by about 50%. (2) The standard deviations of the three-dimensional relative positioning errors with respect to the position at the initial epoch are generally within 10 cm, and the horizontal accuracy can reach 3 cm. In addition, the positioning accuracy of UAV in open environment is better than that of vehicle. (3) The number of observed BDS satellites is obviously more than that of the GPS satellites, whether on the UAV platform or on the vehicle platform. This makes a great contribution to a faster convergence speed and better stability of kinematic positioning for the BDS than those for the GPS.Conclusions The filtering model based on the equivalent elimination principle can achieve shorter convergence time and more accurate positioning results relative to the position at the initial epoch. But it is still susceptible to cycle slips, and cannot obtain accurate absolute positions. In the future work, the approach to accurate absolute position determination at the initial epoch will be investigated, and the real trajectory of the moving target will be achieved thereby.
-
长航时高精度自主导航是发展水下自主航行器亟待解决的技术难题。惯性导航系统(inertial navigation system,INS)作为水下航行器的核心导航设备之一,因其存在随时间变化产生的累积误差,无法满足水下航行器长航时自主导航的高精度要求。地磁导航技术可以为水下航行器提供高隐蔽性的外部校正信息,修正由INS产生的累积误差[1-3]。地磁辅助惯性导航系统涉及到背景磁场构建、地磁导航匹配算法和地磁适配性分析等多项关键技术。适配性是指地磁图对匹配的适应性,即地磁场特征在相关匹配中能够表征地理位置的能力。通过对地磁图适配性的分析,挑选地磁特征显著、信息量丰富、适应性强的区域作为地磁适配区,能够有效提高地磁导航精度[4-7]。
为了解决多指标对单一决策的综合影响,目前已有诸多研究提出了分析方法,文献[8]提出了多属性决策评价地磁适配性的方法,该方法综合考虑地磁标准差、地磁粗糙度、地磁相关系数、地磁信息熵4个特征参数得到综合评价值,与匹配概率有较高的一致性;文献[9]提出了分形维数的评价方法,该方法从原理上分析了分形维数与适配性的关系,发现分形维数在适配性分析上具有很好的性能;文献[10]提出了基于粗糙集理论的地磁特征参数的选取方法,该方法能为适配区评价选取重要特征参数;文献[11]针对人为提取的特征不能客观描述深层次结构性特征的问题,提出了基于深度卷积神经网络的适配性分析方法,可以有效避免地磁特征人工提取的主观性;通过对地磁共生矩阵反演出的角二阶矩、对比度等统计参数的分析,文献[12]提出了基于地磁共生矩阵的地磁适配区选择算法,从多方向反映地磁变化特征以及地磁邻近区域的相关性;文献[13]提出了层次分析方法,定义了地磁场特征参数可信度,分析了特征参数的隐含信息,发现可信度比单一特征参数适配性评价效果更好。从定量角度可以将上述方法归纳为基于决策选优的适配性分析方法,排序和选优的思想是此类方法最显著的特征。通过排序来明确各候选匹配区适配性能的优劣,选优即选取适配性能好的区域作为适配区,然而这类方法存在人为设置阈值和判定准则难提取两个缺点。因此,为了使提取的准则更为客观,本文将模糊决策理论应用到地磁图适配性分析中。
模糊决策理论是运用模糊数学方法处理多目标决策问题,在分析过程中,这些多目标变量属于模糊因素[14]。本文基于地磁图适配性分析中存在多指标性和模糊性的特点,提出了基于模糊决策理论的地磁图适配性分析方法,对特征参数的模糊度指标进行加权分析,构建综合评价值来评定候选区适配性。针对地磁异常的无迹卡尔曼滤波(unscented Kalman filtering,UKF)算法,选取中国南海部分海域的全球地磁异常格网数据(earth magnetic anomaly grid 2,EMAG2)作为地磁异常基准图进行仿真实验,验证了定量分析结果的可靠性和该方法的可行性。
1 地磁图特征参数定义
本文将地磁场数据以格网的形式存储于计算机中,用离散点的形式表示地磁场在空间中的变化规律。设某地磁场区域的经纬度跨度为M×N网格(M为纬度跨度,N为经度跨度),f(i, j)为网格点坐标(i, j)处的地磁异常值。描述地磁图适配性的特征参数多达十几种,根据地磁图特征参数与匹配概率的关联程度,本文选取地磁标准差、粗糙度、相关系数、坡度标准差和地磁信息熵作为评价候选匹配区适配性能的度量。上述5个地磁图特征参数的定义及其计算方法如下[15]。
1) 地磁标准差σ
地磁标准差反映了该区域地磁场离散程度和地磁场总体起伏情况。地磁标准差数值越大,表示该候选匹配区的地磁特征越明显,越适合做地磁匹配。其定义如下:
$$\sigma = \sqrt {\frac{1}{{MN - 1}}\mathop \sum \limits_{i = 1}^M \mathop \sum \limits_{j = 1}^N {{\left( {f\left( {i, j} \right) - \bar f} \right)}^2}} $$ (1) 式中,$\bar f = \frac{1}{{MN}}\mathop \sum \limits_{i = 1}^M \mathop \sum \limits_{j = 1}^N f\left({i, j} \right)$,表示候选匹配区内地磁场的均值。
2) 地磁粗糙度r
地磁粗糙度反映了候选匹配区地磁场的平均光滑程度和地磁场局部起伏状态。地磁粗糙度越大,表示该候选匹配区的地磁信息量越丰富,越有利于进行地磁匹配。其定义如下:
$$r = \frac{{{r_x} + {r_y}}}{2} $$ (2) $${r_x} = \sqrt {\frac{1}{{M\left( {N - 1} \right)}}\mathop \sum \limits_{i = 1}^M \mathop \sum \limits_{j = 1}^{N - 1} {{[f\left( {i, j} \right) - f\left( {i, j + 1} \right)]}^2}} $$ (3) $${r_y} = \sqrt {\frac{1}{{\left( {M - 1} \right)N}}\mathop \sum \limits_{i = 1}^{M - 1} \mathop \sum \limits_{j = 1}^N {{[f\left( {i, j} \right) - f\left( {i + 1, j} \right)]}^2}} $$ (4) 式中,rx表示该区域x方向粗糙度;ry表示该区域y方向粗糙度。
3) 相关系数ρ
地磁相关系数反映了地磁数据之间的独立性。地磁相关系数越小,表明该区域地磁信息越丰富,越有利于地磁匹配定位。定义如下:
$$\rho = \frac{{{\rho _x} + {\rho _y}}}{2} $$ (5) $${\rho _x} = \frac{1}{{M\left( {N - 1} \right){\sigma ^2}}}\mathop \sum \limits_{i = 1}^M \mathop \sum \limits_{j = 1}^{N - 1} \left[ {f\left( {i, j} \right) - \bar f} \right] \cdot \left[ {f\left( {i, j + 1} \right) - \bar f} \right] $$ (6) $${\rho _y} = \frac{1}{{\left( {M - 1} \right)N{\sigma ^2}}}\mathop \sum \limits_{i = 1}^{M - 1} \mathop \sum \limits_{j = 1}^N \left[ {f\left( {i, j} \right) - \bar f} \right] \cdot \left[ {f\left( {i + 1, j} \right) - \bar f} \right] $$ (7) 式中,ρx表示该区域x方向的相关系数;ρy表示该区域y方向的相关系数。
4) 坡度标准差S
地磁坡度S(i, j)为地磁场曲面上一点处的法线方向和垂直方向的夹角,可由地磁场在纬度方向、经度方向的变化率Sx(i, j)、Sy(i, j)确定,其定义如下:
$$\begin{array}{*{20}{c}} {{S_x}\left( {i, j} \right) = [f\left( {i + 1, j + 1} \right) + f\left( {i, j + 1} \right) + }\\ {f\left( {i - 1, j + 1} \right) - f\left( {i + 1, j - 1} \right) - }\\ {f\left( {i, j - 1} \right) - f\left( {i - 1, j - 1} \right)]/6} \end{array} $$ (8) $$\begin{array}{*{20}{c}} {{S_y}\left( {i, j} \right) = [f\left( {i + 1, j + 1} \right) + f\left( {i + 1, j} \right) + }\\ {f\left( {i + 1, j - 1} \right) - f\left( {i - 1, j + 1} \right) - }\\ {f\left( {i - 1, j} \right) - f\left( {i - 1, j - 1} \right)]/6} \end{array} $$ (9) $$S\left( {i, j} \right) = \sqrt {\left[ {{S_x}\left( {i, j} \right){]^2} + } \right[{S_y}\left( {i, j} \right){]^2}} $$ (10) 地磁坡度S(i, j)是针对候选匹配区中每一个格网点而言的,为了能够反映整个候选匹配区的地磁坡度情况,引入坡度标准差Sσ,其定义如下:
$${S_\sigma } = \sqrt {\frac{1}{{\left( {M - 2} \right)\left( {N - 2} \right) - 1}}\mathop \sum \limits_{i = 2}^{M - 1} \mathop \sum \limits_{j = 2}^{N - 1} {{(S\left( {i, j} \right) - \bar S)}^2}} $$ (11) $$\bar S = \frac{1}{{\left( {M - 2} \right)\left( {N - 2} \right)}}\mathop \sum \limits_{i = 2}^{M - 1} \mathop \sum \limits_{j = 2}^{N - 1} S\left( {i, j} \right) $$ (12) 5) 地磁信息熵H
地磁信息熵越小,代表地磁场特征越独特,该区域越有利于进行地磁匹配定位。其定义如下:
$$H = - \mathop \sum \limits_{i = 1}^M \mathop \sum \limits_{j = 1}^N p\left( {i, j} \right) \cdot {\rm{lo}}{{\rm{g}}_2}\;p\left( {i, j} \right) $$ (13) $$p\left( {i, j} \right) = \frac{{f\left( {i, j} \right)}}{{\mathop \sum \limits_{i = 1}^M \mathop \sum \limits_{j = 1}^N f\left( {i, j} \right)}} $$ (14) 当对数的底数取2时,熵的单位为bit。
2 基于模糊决策理论的地磁图适配性分析
为了综合考虑地磁标准差、粗糙度、相关系数、坡度标准差及地磁信息熵等5个特征参数对适配性分析的影响,首先构建指标矩阵,然后构建隶属度矩阵对这5种不同类属的特征参数进行模糊控制,最后引入权重向量进一步提高综合评价矩阵的合理性[16-17]。
1) 构建指标矩阵X
设有m块待选区域,有n个评价指标来描述,则有m×n阶指标矩阵,其定义如下:
$$\mathit{\boldsymbol{X}} = \left[ {\begin{array}{*{20}{c}} {{x_{11}}}&{{x_{12}}}& \cdots &{{x_{1n}}}\\ {{x_{21}}}&{{x_{22}}}& \cdots &{{x_{2n}}}\\ \vdots & \vdots &{}& \vdots \\ {{x_{m1}}}&{{x_{m2}}}& \cdots &{{x_{mn}}} \end{array}} \right] = {({x_{ij}})_{m \times n}} $$ (15) 式中,xij表示第i个待分析对象的第j个评价因素的指标特征量,$i = 1, 2 \cdots m, j = 1, 2 \cdots n$。
2) 指标归一化
隶属度rij'的计算如下:
$$r_{i j}^{\prime}=\left\{\begin{array}{l} x_{i j} / x_{\mathrm{max}}, \text { 越大越优型 } \\ x_{\min } / x_{i j}, \text { 越小越优型 } \end{array}\right. $$ (16) 式中,xmax表示xij的最大值;xmin表示xij的最小值。
地磁标准差、地磁粗糙度、地磁坡度属于越大越优型,相关系数及地磁信息熵则属于越小越优型。由于各属性的量纲和取值范围相差较大,需要将不同属性的量纲进行标准化处理,使标准化转换后的评价值rij均值为0,方差为1。计算如下:
$$r_{i j}=\frac{r_{i j}^{\prime}-m_{j}}{\sigma_{j}} $$ (17) $$m_{j}=\frac{1}{m} \sum\limits_{i=1}^{m} r_{i j}^{\prime} $$ (18) $$\sigma_{j}=\sqrt{\frac{1}{m-1} \sum\limits_{i=1}^{m}\left(r_{i j}^{\prime}-m_{j}\right)^{2}} $$ (19) 式中,mj为第j个属性的均值;σj表示第j个属性值的标准差。
3) 多目标模糊关联矩阵的构造
根据式(14)构建指标隶属度矩阵Rm×n,其定义如下:
$${\mathit{\boldsymbol{R}}_{m \times n}} = \left[ {\begin{array}{*{20}{c}} {{r_{11}}}&{{r_{12}}}& \cdots &{{r_{1n}}}\\ {{r_{21}}}&{{r_{22}}}& \cdots &{{r_{2n}}}\\ \vdots & \vdots &{}& \vdots \\ {{r_{m1}}}&{{r_{m2}}}& \cdots &{{r_{mn}}} \end{array}} \right] $$ (20) 式中,$i = 1, 2 \cdots m; j = 1, 2 \cdots n$。
4) 权重向量的确定
由于各指标对适配性的影响程度各不相同,为实现综合评价结果的合理性,必须对各指标进行加权处理,定义权向量w为:
$$\mathit{\boldsymbol{w}} = \left( {{w_1}, {w_2} \cdots {w_m}} \right) = \left( {\frac{{{s_1}}}{{\mathop \sum \limits_{i = 1}^m {s_i}}}, \frac{{{s_2}}}{{\mathop \sum \limits_{i = 1}^m {s_i}}} \cdots \frac{{{s_m}}}{{\mathop \sum \limits_{i = 1}^m {s_i}}}} \right){\rm{}} $$ (21) $${s_i} = {\rm{exp}}\left[ {\mu \mathop \sum \limits_{j = 1}^n \mathop \sum \limits_{k = 1}^n \left| {{r_{ij}} - {r_{ik}}} \right|/\left( {1 - \mu } \right) - 1} \right]{\rm{}} $$ (22) 式中,μ代表平衡系数(0 < μ < 1)。
5) 综合评判矩阵
将式(21)所得权重矩阵与式(20)所得隶属度矩阵组合构成综合评判矩阵V,其定义如下:
$$\mathit{\boldsymbol{V}} = \mathit{\boldsymbol{wR}} = \left( {{w_1}, {w_2} \cdots {w_m}} \right)\left[ {\begin{array}{*{20}{c}} {{r_{11}}}&{{r_{12}}}& \cdots &{{r_{1n}}}\\ {{r_{21}}}&{{r_{22}}}& \cdots &{{r_{2n}}}\\ \vdots & \vdots &{}& \vdots \\ {{r_{m1}}}&{{r_{m2}}}& \cdots &{r_{mn}^{}} \end{array}} \right] $$ (23) 3 数据计算及结果评定
本文选取分辨率为2″的全球地磁异常格网数据EMAG2,将范围为108°E~113°E、10°N~15°N的中国南海部分海域地磁异常格网数据作为实验的地磁异常基准图,如图 1所示,该地区的地磁图特征样式繁多,很难直观对各区域的适配性优劣作出直接判断。
将图 1所示区域等间隔划分为16个候选匹配区域,以便进行计算及结果分析,候选匹配区域1~16的地磁图特征参数统计量见表 1,表 1同时给出了相应地磁图特征参数的数值大小排序结果。
表 1 单一地磁图特征参数值及其排序Table 1. Rank Results of Single Geomagnetic Map Feature Parameter区域编号 标准差σ 粗糙度r 相关系数 坡度标准差S 信息熵H 数值/nT 排序 数值 排序 数值 排序 数值 排序 数值/bit 排序 1 4.144 9 9 0.933 9 12 0.992 1 5 1.342 2 10 10.112 7 5 2 3.520 3 11 1.530 7 3 0.977 2 14 1.856 7 6 10.014 2 13 3 4.374 3 8 1.771 3 2 0.994 7 3 2.304 1 2 9.823 9 16 4 3.708 0 10 1.131 8 8 0.991 6 6 1.432 7 8 10.113 7 4 5 4.409 5 7 0.960 3 10 0.987 8 8 1.094 6 13 10.180 2 1 6 2.698 5 14 0.866 9 13 0.987 3 9 1.274 9 11 10.024 0 12 7 6.987 7 2 1.049 4 9 0.996 0 1 1.481 2 7 10.000 0 14 8 4.459 7 5 0.845 5 14 0.994 4 4 0.969 7 14 10.150 5 2 9 2.649 9 15 2.067 4 1 0.960 9 15 2.829 0 1 10.041 4 10 10 2.865 5 12 1.286 5 5 0.984 2 11 1.861 3 4 10.059 7 8 11 2.753 5 13 0.392 0 16 0.985 5 10 0.602 6 16 10.092 6 6 12 4.416 4 6 1.247 4 6 0.978 6 13 1.857 8 5 10.031 4 11 13 2.552 3 16 0.935 5 11 0.958 7 16 1.242 5 12 9.943 1 15 14 7.359 4 1 1.339 9 4 0.995 2 2 1.908 8 3 10.062 0 7 15 4.815 8 4 0.742 0 15 0.990 8 7 0.896 8 15 10.041 8 9 16 5.330 5 3 1.158 5 7 0.983 6 12 1.414 7 9 10.117 2 3 由式(15)~(23)求解可得各适配区的综合评定结果,根据计算值大小对各区域适配性优劣进行排序,结果如表 2所示。
表 2 各候选匹配区综合评定值及其排序Table 2. Rank Results of Candidate Matching Regions区域编号 综合评定值 排序 1 2.033 5 10 2 2.774 0 6 3 3.431 6 2 4 2.165 1 8 5 1.680 1 13 6 1.927 8 11 7 2.291 1 7 8 1.499 8 14 9 4.170 7 1 10 2.775 5 4 11 0.954 0 16 12 2.775 1 5 13 1.869 3 12 14 2.872 6 3 15 1.394 1 15 16 2.144 4 9 由表 1可知,若分别以地磁粗糙度、地磁坡度作为评价依据,9号区域适配性最好;若以地磁信息熵作为评价依据,3号区域适配性最优。由此可知,利用单一特征参数作为评价依据所得结果并不一致。因此,单一地磁图特征参数作为候选匹配区适配性评价依据进行分析存在不合理性,而基于模糊决策理论能够综合主要特征参数进行加权分析,构建出综合评价值来评定候选匹配区的适配性。
为了验证基于模糊决策理论的地磁图适配性评估方法所得综合评定结果的正确性和可靠性,本文采用基于地磁异常的UKF滤波算法,选取16个候选匹配区当中的9号(排序1)、4号(排序8)和11号(排序16)3块区域进行仿真实验。在航迹仿真实验中,设置了航迹1和航迹2两条航迹进行验证分析。水下自主航行器(autonomous underwater vehicle,AUV)的运动状态如下:先进行匀加速运动,再匀速运动,然后转弯,最后变成匀速状态。惯导航迹仿真参数设置如表 3所示,区域9、4、11的仿真航迹结果分别如图 2、图 3、图 4所示。
表 3 仿真参数设置Table 3. Simulation Parameter Setting参数 参数值 惯性导航初始经度误差/n mile 2 惯性导航初始纬度误差/n mile 2 陀螺零偏/((°)·h-1) 0.01 加表零偏/(m·s-2) 1×10⁻⁵ AUV匀速运动速度/(n mile·h-1) 9.7 AUV偏航角/(°) 50 AUV航行时间/h 10.29 惯性导航初始状态方差/(°)2 0.001 地磁图噪声方差/(nT)2 10 地磁测量噪声方差/(nT)2 10 综合两条航迹,对9号、4号以及11号候选匹配区分别沿经度和纬度方向对基于UKF滤波方法的绝对匹配误差进行统计,结果如表 4所示。
表 4 绝对匹配误差统计值Table 4. Statistics of Absolute Matching Errors方向 编号 最大值/n mile 最小值/n mile 平均值/n mile 均方误差/n mile 纬向 9 1.869 6 0.003 1 0.935 7 0.332 0 4 4.493 2 0.003 2 2.332 3 2.186 0 11 18.897 5 0.028 6 10.584 4 6.002 7 经向 9 1.375 1 0.009 8 0.892 8 0.384 7 4 4.895 4 0.010 2 2.707 0 2.133 4 11 12.907 7 0.106 5 8.146 9 5.899 1 由图 2~4可知,9号区域较4号区域的匹配航迹更接近真实轨迹,11号区域则在匹配过程中出现误匹配现象。由表 4仿真实验结果可得,综合评价值更高的区域,纬向和经向绝对匹配误差也越小。实验结果表明,综合评价值高的区域其适配性能更好,可以选取相应区域作为适配区。
4 结语
本文提出了基于模糊决策理论的地磁图适配性分析方法,对图 1中的各个候选匹配区的适配性进行定量分析,得出综合评价值作为评价依据,并且进行航迹仿真实验验证了该方法的可靠性。实验结果表明,基于模糊决策的地磁图适配性分析结果与仿真实验结果具有较好的一致性,且综合评价值越高,匹配效果越好。且该方法解决了仅依据单一评价指标进行分析的不全面问题,得出综合评价值作为地磁图适配性优劣评判的定量分析依据,对航迹规划问题也具有一定指导意义。
-
表 1 3种滤波模型的收敛时间及收敛后的定位偏差标准差(无人机实验)
Table 1 Convergence Time and STD of Position Errors After Convergence for GPS and BDS (UAV Experiment)
系统 滤波
模型收敛时间/s 标准差/m E N U H 3D GPS 模型一 0.188 0.218 0.299 0.288 0.415 模型二 43 0.115 0.071 0.072 0.135 0.153 模型三 23 0.028 0.038 0.107 0.046 0.117 BDS 模型一 0.143 0.145 0.163 0.204 0.261 模型二 33 0.037 0.064 0.053 0.074 0.091 模型三 10 0.026 0.013 0.044 0.029 0.053 表 2 3种滤波模型的收敛时间及收敛后定位误差标准差(汽车实验)
Table 2 Convergence Time and STD of Position Errors After Convergence for GPS and BDS (Vehicle Experiment)
系统 滤波
模型收敛时间/s 标准差/m E N U H 3D GPS 模型一 0.198 0.328 0.399 0.383 0.553 模型二 46 0.170 0.041 0.064 0.175 0.186 模型三 13 0.036 0.031 0.119 0.048 0.128 BDS 模型一 0.155 0.242 0.344 0.287 0.448 模型二 7 0.090 0.127 0.033 0.156 0.159 模型三 4 0.051 0.065 0.057 0.083 0.100 -
[1] IMT-2020(5G)推进组. 定位白皮书: 车辆高精度定位白皮书[R]. 北京: 中国联通网络技术研究院, 2019. IMT-2020(5G) Promotion Group. Positioning White Paper: Vehicle High Precision Positioning White Paper[R]. Beijing: China Unicom Network Technology Research Institute, 2019
[2] 杨元喜. 中国卫星导航应用产业发展思考[J]. 卫星与网络, 2011(S1): 18-20. https://www.cnki.com.cn/Article/CJFDTOTAL-WXWL2011Z1005.htm Yang Yuanxi. Thoughts on the Development of Satellite Navigation Application Industry in China[J]. Satellite and Network, 2011(S1): 18-20 https://www.cnki.com.cn/Article/CJFDTOTAL-WXWL2011Z1005.htm
[3] 刘经南, 高柯夫. 智能时代测绘与位置服务领域的挑战与机遇[J]. 武汉大学学报(信息科学版), 2017, 42(11): 1506-1517. doi: 10.13203/j.whugis20170324 Liu Jingnan, Gao Kefu. Challenges and Opportunities for Mapping and Surveying and Location Based Service in the Age of Intelligence[J]. Geomatics and Information Science of Wuhan University, 2017, 42(11): 1506-1517 doi: 10.13203/j.whugis20170324
[4] Grewal M S, Andrews A P, Bartone C. Global Navigation Satellite Systems, Inertial Navigation, and Integration[M]. New York, USA: John Wiley and Sons, 2020.
[5] Maurici L. An Introduction to the Extended Kalman Filter [M]. New York, USA: Nova Science Publishers, 2020.
[6] Yamaguchi S, Tanaka T. GPS Standard Positioning Using Kalman Filter[C]//SICE-ICASE International Joint Conference, Busan, Korea(South), 2007.
[7] 唐卫明, 张先春, 惠孟堂, 等. 基于卡尔曼滤波的北斗伪距单点定位算法研究[J]. 测绘通报, 2016(10): 6-8. https://www.cnki.com.cn/Article/CJFDTOTAL-CHTB201610002.htm Tang Weiming, Zhang Xianchun, Hui Mengtang, et al. Research on BeiDou Pseudorange Single Point Positioning Algorithm Based on Kalman Filter[J]. Bulletin of Surveying and Mapping, 2016(10): 6-8 https://www.cnki.com.cn/Article/CJFDTOTAL-CHTB201610002.htm
[8] 郭磊, 王甫红, 桑吉章, 等. 一种新的利用历元间位置变化量约束的GNSS导航算法[J]. 武汉大学学报(信息科学版), 2020, 45(1): 21‐27. doi: 10.13203/j.whugis20190062 Guo Lei, Wang Fuhong, Sang Jizhang, et al. A New GNSS Navigation Algorithm Based on the Constraint of Position Variation Between Epochs[J]. Geomatics and Information Science of Wuhan University, 2020, 45(1): 21‐27 doi: 10.13203/j.whugis20190062
[9] 周江文. 误差理论[M]. 北京: 测绘出版社, 1979. Zhou Jiangwen. Theory of Errors[M]. Beijing: Surveying and Mapping Press, 1979
[10] Schaffrin B, Grafarend E. Generating Classes of Equivalent Linear Models by Nuisance Parameter Elimination, Applications to GPS Observations [J]. Manuscripta Geodaetica, 1986, 11: 262-271.
[11] Shen Y, Xu G. Simplified Equivalent Representation of GPS Observation Equations[J]. GPS Solutions, 2008, 12(2): 99-108. doi: 10.1007/s10291-007-0070-z
[12] Chen W, Hu C, Li Z, et al. Kinematic GPS Precise Point Positioning for Sea Level Monitoring with GPS Buoy[J]. Journal of Global Positioning Systems, 2004, 3(1/2): 302-307.
[13] 崔希璋, 於宗俦, 陶本藻, 等. 广义测量平差[M]. 武汉: 武汉大学出版社, 2009. Cui Xizhang, Yu Zongtao, Tao Benzaochou, et al. Generalized Surveying Adjustment[M]. Wuhan: Wuhan University Press, 2009
[14] Klobuchar J A. Ionospheric Time-delay Algorithm for Single-Frequency GPS Users[J]. IEEE Transactions on Aerospace and Electronic Systems, 1987, 23(3): 325-331.
[15] Yuan Y, Huo X, Ou J, et al. Refining the Klobuchar Ionospheric Coefficients Based on GPS Observations[J]. IEEE Transactions on Aerospace and Electronic Systems, 2008, 44(4): 1498-1510.
[16] Wang N, Yuan Y, Li Z, et al. Improvement of Klobuchar Model for GNSS Single-Frequency Ionospheric Delay Corrections[J]. Advances in Space Research, 2016, 57(7): 1555-1569.
[17] Hopfield H. Two-Quartic Tropospheric Refractivity Profile for Correcting Satellite Data[J]. Journal of Geophysical Research, 1969, 74(18): 4487-4499.
[18] 邓辰龙. 多频多系统GNSS实时双差模糊度解算理论与方法研究[D]. 武汉: 武汉大学, 2016. Deng Chenlong. Theory and Approach of Multi-frequency and Multi-constellation GNSS Real Time Double Differenced Ambiguity Resolution[D]. Wuhan: Wuhan University, 2016
[19] 李征航, 黄劲松. GPS测量与数据处理[M]. 武汉: 武汉大学出版社, 2010. Li Zhenghang, Huang Jinsong. GPS Surveying and Data Processing[M]. Wuhan: Wuhan University Press, 2010
[20] Colosimo G, Crespi M, Mazzoni A. Real-time GPS Seismology with a Stand-alone Receiver: A Preliminary Feasibility Demonstration[J]. Journal of Geophysical Research: Solid Earth, 2011, 116(B11): 302.
[21] 刘先冬, 宋力杰, 黄令勇. 历元间差分定位模型的粗差探测法探测周跳[J]. 测绘科学, 2011, 36(6): 58-60. https://www.cnki.com.cn/Article/CJFDTOTAL-CHKD201106021.htm Liu Xiandong, Song Lijie, Huang Lingyong. Outlier Detection in Detecting Cycle Slips Based on Epoch-Difference Location Model[J]. Science of Surveying and Mapping, 2011, 36(6): 58-60 https://www.cnki.com.cn/Article/CJFDTOTAL-CHKD201106021.htm
[22] 邹璇, 李宗楠, 陈亮, 等. 一种历元间差分单站单频周跳探测与修复方法[J]. 武汉大学学报(信息科学版), 2017, 42(10): 1406-1410. doi: 10.13203/j.whugis20150805 Zou Xuan, Li Zongnan, Chen Liang, et al. A New Cycle Slip Detection and Repair Method Based on Epoch Difference for a Single-Frequency GNSS Receiver[J]. Geomatics and Information Science of Wuhan University, 2017, 42(10): 1406-1410 doi: 10.13203/j.whugis20150805
[23] Xu G. GPS Data Processing with Equivalent Observation Equations[J]. GPS Solutions, 2002, 6(1): 28-33.
[24] Blewitt G. An Automatic Editing Algorithm for GPS Data[J]. Geophysical Research Letters, 1990, 17(3): 199-202.
[25] Lou Y, Zheng F, Gu S, et al. Multi-GNSS Precise Point Positioning with Raw Single-Frequency and Dual-Frequency Measurement Models[J]. GPS Solutions, 2016, 20(4): 849-862.
[26] Yao Y, Zhang R, Song W, et al. An Improved Approach to Model Regional Ionosphere and Accelerate Convergence for Precise Point Positioning[J]. Advances in Space Research, 2013, 52(8): 1406-1415.


 下载:
下载:


